Brown Dwarf Evolutionary Models
The SPLAT brown dwarf evolutionary model package serves routines that allow for the conversion between physical (e.g., mass, age) and observable parameters (temperature, luminosity, radius, surface gravity) using published evolutionary model grids.
The evolutionary models currently available through this package are:
burrows: Models from Burrows et al. (2001) for 1 Myr < age < 10 Gyr, 0.005 Msol < mass < 0.2 Msol, and solar metallicity
baraffe03: Models from Baraffe et al. (2003) for 1 Myr < age < 10 Gyr, 0.005 Msol < mass < 0.1 Msol, and solar metallicity, with the COND dust prescription
- baraffe15: Models from Baraffe et al. (2015) for 1 Myr < age < 10 Gyr, 0.07 Msol < mass < 1.4 Msol, and solar metallicity, with the BT-Settl dust prescription
saumon: Models from Saumon et al. (2003) for 3 Myr < age < 10 Gyr, 0.002 Msol < mass < 0.085 Msol, although the actual ranges vary as the maximum temperature for the models is 2500 K. For this model set, there are additional options for:
metallicity = solar, +0.3, -0.3
cloud = cloud-free, hybrid, f2
These models are contained in SPLAT's reference/EvolutionaryModels folder.
The primary routine is modelParameters() which takes as inputs the model name and two of the following
parameters: mass, age, temperature, luminosity, gravity, or radius. These can be entered as
individual values or arrays. Using the input parameters, the associated evolutionary
model parameters are computed through log-linear interpolation of the original model grid. Parameters
that fall outside the grid return nan.
>>> import splat.evolve as spev
>>> import numpy
>>> masses = numpy.random.uniform(0.01,0.1,20)
>>> ages = numpy.random.uniform(0.01,10,20)
>>> p = spev.modelParameters('baraffe',mass=masses,age=ages)
You are using baraffe's models.
>>> print(p.temperature)
[ 2502.90132332  2818.85920306  1002.64227134  1330.37273021  1192.86976417
  500.45609068  2604.99966013  1017.03307609  1774.18267474  1675.12181635
  2682.9697321   2512.45223777   346.41152614  2066.19972036   843.28528456
  2264.93051445  2767.85660557   348.84214986   922.87030167  2669.27152307] K
The models themselves are read in through the loadEvolModel() routine:
>>> import splat.evolve as spev
>>> p = spev.loadEvolModel('saumon',metallicity=-0.3,cloud='nc')
You are using saumon's models.
>>> for k in list(p.keys()): print('{}: {}'.format(k, p[k][12]))
age: 0.15
mass: [ 0.002  0.003  0.004  0.005  0.006  0.007  0.008  0.009  0.01   0.011
  0.012  0.013  0.014  0.015  0.016  0.017  0.018  0.019  0.02   0.022
  0.024  0.026  0.028  0.03   0.033  0.035  0.038  0.04   0.043  0.045
  0.048  0.05   0.053]
temperature: [  353.   418.   471.   523.   585.   642.   695.   748.   806.   893.
  1146.  1228.  1114.  1113.  1148.  1183.  1227.  1270.  1316.  1402.
  1489.  1572.  1654.  1739.  1853.  1930.  2030.  2096.  2187.  2240.
  2316.  2362.  2426.]
gravity: [ 3.576  3.746  3.871  3.972  4.056  4.128  4.191  4.246  4.296  4.335
  4.337  4.368  4.437  4.479  4.512  4.543  4.571  4.597  4.621  4.665
  4.704  4.74   4.772  4.8    4.839  4.861  4.892  4.909  4.931  4.947
  4.966  4.978  4.996]
luminosity: [-6.691 -6.393 -6.185 -6.006 -5.815 -5.658 -5.527 -5.404 -5.277 -5.098
 -4.628 -4.505 -4.709 -4.724 -4.675 -4.627 -4.568 -4.51  -4.45  -4.342
 -4.24  -4.146 -4.058 -3.969 -3.856 -3.781 -3.69  -3.628 -3.546 -3.5   -3.432
 -3.393 -3.34 ]
radius: [ 0.1206  0.1214  0.1214  0.1209  0.1202  0.1195  0.1189  0.1182  0.1178
  0.1181  0.123   0.1235  0.1184  0.1167  0.1161  0.1154  0.1151  0.1148
  0.1146  0.1142  0.1139  0.1139  0.1138  0.1141  0.1144  0.115   0.1155
  0.1163  0.1174  0.118   0.1193  0.12    0.121 ]
It is also possible to visualize various parameter spaces using the plotModelParameters() routine.
>>> import splat.evolve as spev
>>> import numpy
>>> age_samp = 10.**numpy.random.normal(numpy.log10(1.),0.3,50)
>>> mass_samp = numpy.random.uniform(0.001,0.1,50)
>>> p = spev.modelParameters('baraffe',age=age_samp,mass=mass_samp)
>>> spev.plotModelParameters(p,'age','temperature',showmodels=True,model='baraffe',show=True)
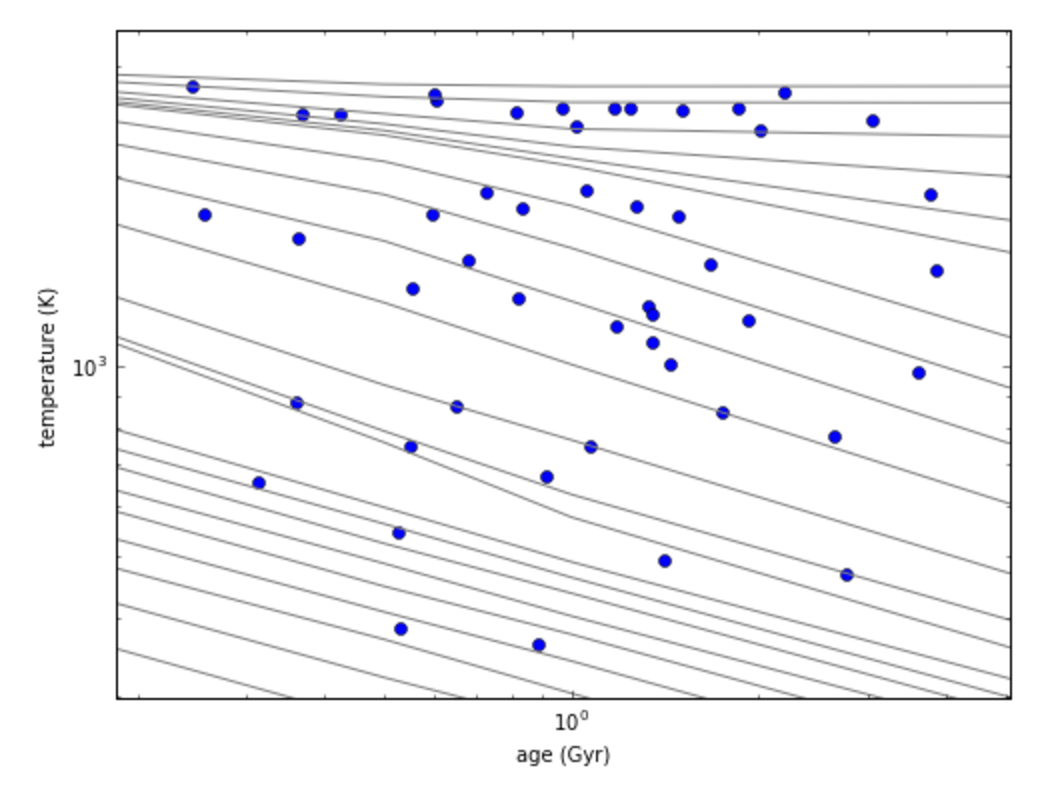
Any two parameters can be plotted against each other, and you can examine either isochrones or constant mass tracks
using the tracks keyword. See the SPLAT API entry for plotModelParameters() for more details.
Search