Photometry package
This package contains several functions related to spectrophotometry, using either built-in filter profiles curated from the SVO Filter Profile Service or user-defined. These functions can be called up by importing the splat.photometry package:
>>> import splat.photometry as spphot
Key functions include:
- filterMag()
Retrieves the filter profile from the SPLAT filter library, and returns two arrays: the filter wavelength and filter transmission curve. This function is also contained within the Spectrum object
Example:
>>> import splat
>>> import splat.photometry as spphot
>>> sp = splat.getSpectrum(shortname='1507-1627')[0]
>>> sp.fluxCalibrate('MKO J',14.5)
>>> print(spphot.filterMag(sp,'MKO J'))
    (14.499999979756499, 0.0010606102934068472)
>>> print(sp.filterMag('MKO J'))
    (14.499999979756499, 0.0011216264136789818)
- `checkFilter()`_
Checks that a filter is in the SPLAT filter library
Example:
>>> import splat.photometry as spphot
>>> spphot.checkFilter('2MASS J')
2MASS_J
>>> spphot.checkFilter('2MASS Y')
Filter 2MASS Y not currently available for SPLAT
Try ['2MASS_J', '2MASS_H', '2MASS_KS', 'BESSEL_U', 'BESSEL_B', 'BESSEL_V', ...
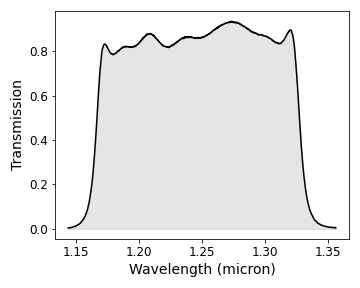
- filterProfile()
Retrieves the filter profile from the SPLAT filter library, and returns two arrays: the filter wavelength and filter transmission curve.
Example:
>>> import splat.photometry as spphot
>>> lam,trans = spphot.filterProfile('2MASS J',plot=True,fill=True)
- visualizeFilter()
Plots a filter or set of filter transmission curves, and optionally a comparison spectrum.
Example:
>>> import splat
>>> import splat.photometry as spphot
>>> sp = splat.getSpectrum(shortname='1507-1627')[0]
>>> sp.normalize()
>>> spphot.visualizeFilter(['MKO Y','MKO J','MKO H','MKO K'],comparison=sp,color=['c','b','g','m'],fill=True)

- `filterInfo()`_
Prints out information for a filter in the SPLAT filter library.
Example:
>>> import splat.photometry as spphot
>>> spphot.filterInfo('MKO J')
MKO J: MKO J-band + atmosphere
    Wavelength range = 1.148 micron to 1.349 micron
    Zeropoint = 1562.30 Jy
    Central wavelength: = 1.249 micron
    Mean wavelength: = 1.248 micron
    Pivot point: = 1.247 micron
    FWHM = 0.162 micron
    Vega to AB = 0.911
- vegaToAB()
Gives filter offset between Vega and AB magnitudes within a given filter transmission curve
Example:
>>> import splat.photometry as spphot
>>> spphot.vegaToAB('2MASS J')
0.8923112818878385
- `magToFlux()`_
Converts a magntiude in a given filter to integrated flux units
Example:
>>> import splat.photometry as spphot
>>> spphot.magToFlux(14,'MKO J',unc=0.1)
(<Quantity 1.08182532e-12 erg / (s cm2)>, <Quantity 1.00599678e-13 erg / (s cm2)>)
Useful Program Constants
splat.FILTERSDictionary containing pre-stored filters
Search